
I am currently working on a ERP System, which has already been deployed on various super markets, grocery shops in Qatar, the back-end is developed using Laravel Framework and Front end is developed using mix of Vue.JS and Blade templates,
Recently I received a request from one of my client who has super market with many branches in various locations, he was interested to know What Product Categories Generate Most Volume of sales and during which month, he has highest number of sales,
by having such a Data Visualization Graph,
- he can increase the stock for those particular products during the months which has highest number of customer orders
- he can satisfy his customers needs at the right time
- increase the ROI
- boost the stock moving etc..
I understand I need to provide him a Laravel Data Visualization chart ,
so I developed a small Laravel Module, that make him ease of generating the chart by configurable date,periods, and with choices of chart types such as Bar,Column,Line etc..
in this blog post i will describe step by step on how i completed successfully a Laravel Package that meets my clients requirement,
First let's have a look on the bellow figure, it shows how's my database design is structured for the relevant tables to make this chart,
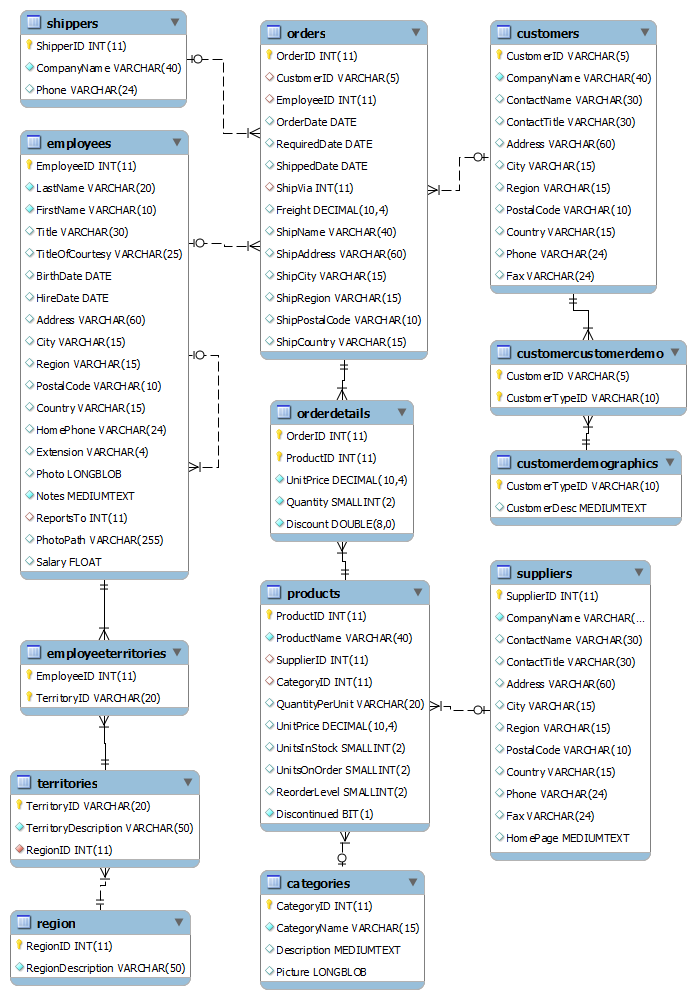
Database Table Explanation
- Customers – stores customer master data
- Orders – stores transaction sale orders from customers
- OrderDetails – stores line items of sale orders
- Products – stores products master data
- Categories - stores product categories master data
- Suppliers – stores suppliers master data
- Shippers – stores shippers master data
- Region – stores region master data
- Territories – store territories master data
- Employees – store employees master data
- EmployeeTerritories – store relationship between employee and territory
Deeply analyzing the database structure and the customer requirement, I am highlighting the database tables which we need to make this Laravel Data Visualization chart bellow,
- Categories
- Products
- Orders
- OrderDetails
- yearly_month_calendar
and I created one extra table bellow which will contain all calendar months of certain years in which I expect my customer may generate the graph.
for now I insert month from year2015 to 2018, but it must contain all the years in which your client business is operational,
for example you may write a crone job that will automatically fill this table with all 12 months on every beginning of a new year.
CREATE TABLE IF NOT EXISTS `yearly_month_calendar` (
  `monthYear` varchar(255) COLLATE utf8_unicode_ci NOT NULL,
  `monthYearStart` date NOT NULL
) ENGINE=MyISAM DEFAULT CHARSET=utf8 COLLATE=utf8_unicode_ci;

INSERT INTO `yearly_month_calendar` (`monthYear`, `monthYearStart`) VALUES
('January-2015', '2015-01-01'),
('February-2015', '2015-02-01'),
('March-2015', '2015-03-01'),
('April-2015', '2015-04-01'),
('May-2015', '2015-05-01'),
('June-2015', '2015-06-01'),
('July-2015', '2015-07-01'),
('August-2015', '2015-08-01'),
('September-2015', '2015-09-01'),
('October-2015', '2015-10-01'),
('November-2015', '2015-11-01'),
('December-2015', '2015-12-01'),
('January-2016', '2016-01-01'),
('February-2016', '2016-02-01'),
('March-2016', '2016-03-01'),
('April-2016', '2016-04-01'),
('May-2016', '2016-05-01'),
('June-2016', '2016-06-01'),
('July-2016', '2016-07-01'),
('August-2016', '2016-08-01'),
('September-2016', '2016-09-01'),
('October-2016', '2016-10-01'),
('November-2016', '2016-11-01'),
('December-2016', '2016-12-01'),
('January-2017', '2017-01-01'),
('February-2017', '2017-02-01'),
('March-2017', '2017-03-01'),
('April-2017', '2017-04-01'),
('May-2017', '2017-05-01'),
('June-2017', '2017-06-01'),
('July-2017', '2017-07-01'),
('August-2017', '2017-08-01'),
('September-2017', '2017-09-01'),
('October-2017', '2017-10-01'),
('November-2017', '2017-11-01'),
('December-2017', '2017-12-01'),
('January-2018', '2018-01-01'),
('February-2018', '2018-02-01'),
('March-2018', '2018-03-01'),
('April-2018', '2018-04-01'),
('May-2018', '2018-05-01'),
('June-2018', '2018-06-01'),
('July-2018', '2018-07-01'),
('August-2018', '2018-08-01'),
('September-2018', '2018-09-01'),
('October-2018', '2018-10-01'),
('November-2018', '2018-11-01'),
('December-2018', '2018-12-01');
You may ask me the Reason to have this table yearly_month_calendar , let me explain it,
prior to make the graph, we need to write a SQL query which will return a result set organized in a way, every product categories are into each raw and months intersecting as columns for the period selected,
each month cell contains the number of sales in that particular month for the product category cell in the raw.
Similar example given bellow for period selected from 2017-01-01 to 2017-12-31:
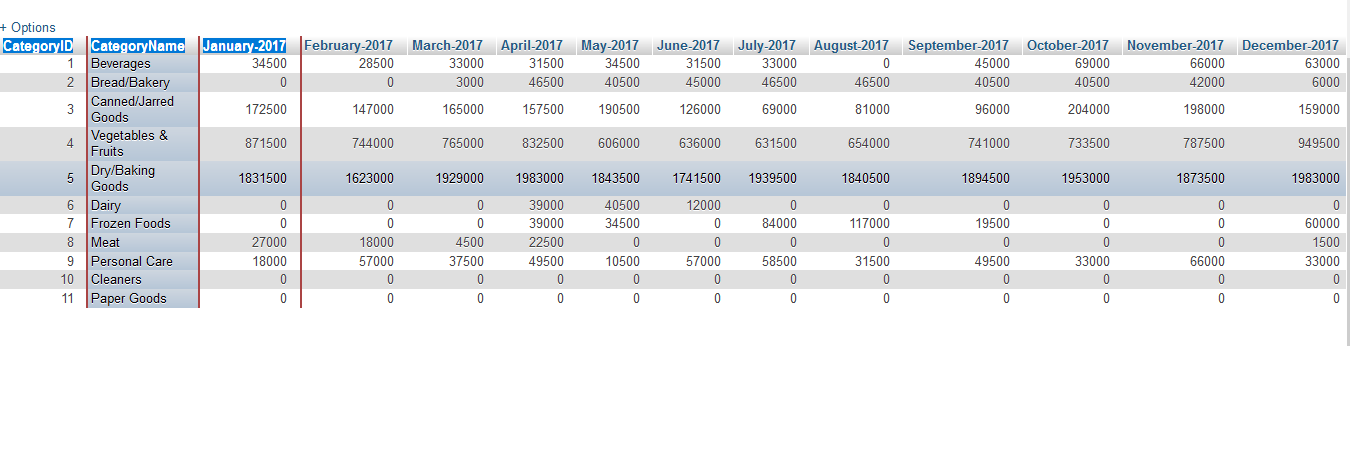
so coming back to our question and analyzing the previous query result, we can see every product category have a month cell, the month column is variable that mean it has to be populated from the start and End dates supplied by user, assume if we skip this table and we directly use the OrderDate column in the Orders table, we will have missing columns for certain product categories which may not have any orders during any particular month.
so that is why the yearly_month_calendar table is very important for this query.
Solution
Step 1.
I will write a SQL Query which groups customer Orders by Product Category, Month Ordered and Number of Sales
SELECT
categories.CategoryID,
categories.CategoryName,
DATE_FORMAT(orders.OrderDate, '%M-%Y') AS month_ordered,
SUM(orderdetails.Quantity) AS total_sales
FROM
orderdetails
INNER JOIN
orders
ON orderdetails.OrderID = orders.OrderID
INNER JOIN
products
ON orderdetails.ProductID = products.ProductID
INNER JOIN
categories
ON products.CategoryID = categories.CategoryID
WHERE
orders.OrderDate >= '2017-01-01'
AND orders.OrderDate <= '2017-12-31'
GROUP BY
month_ordered,
categories.CategoryID
ORDER BY
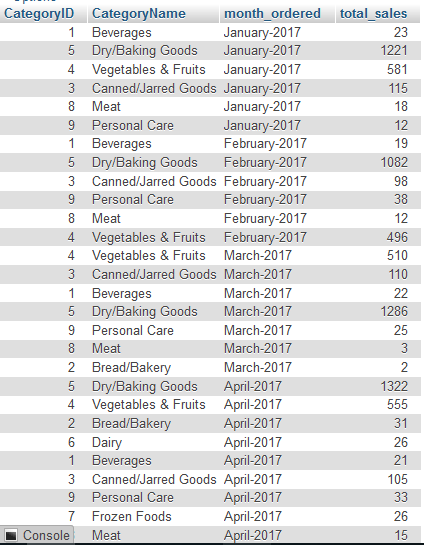
orders.OrderDate ASCwhen I execute the above query, I get a result similar to the following for entire year from January to December, to save space I only show result until April of the query execution, note here there were no sales for Bread/Bakery during January and February but it exists in March,
Step 2
in this step I need to rotate the values of month_ordered column as unique column, This type of rotation of data from columns to rows is known as PIVOTING in terms of SQL. MySQL does not have a native pivot function but we can use an aggregate function with a CASE expression as an alternative to PIVOTING to get the result similar to bellow.
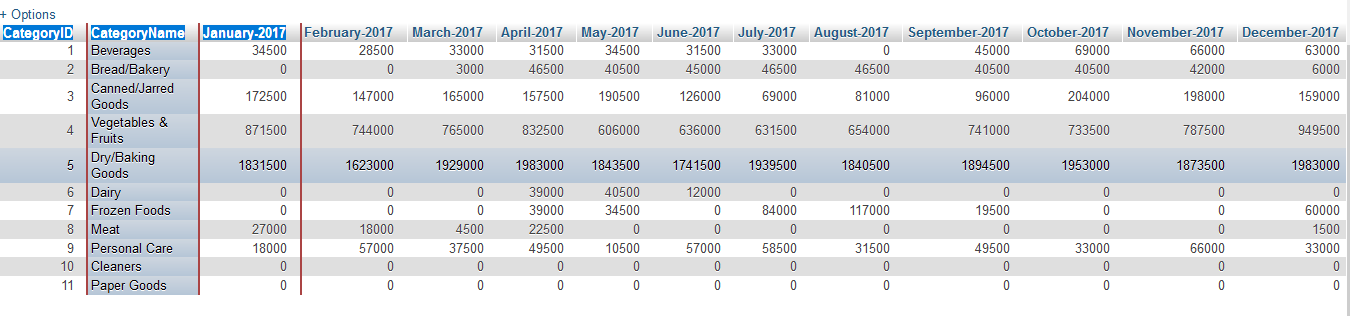
Considering the point in the step 1 (there were no sales for Bread/Bakery during January and February but it exists in March), we still need show a value 0 during January and February like in the above picture.
to do show where we need to use yearly_month_calendar table and construct the following query,
SET @sql = NULL;
SELECT
  GROUP_CONCAT(DISTINCT
               CONCAT(
                   'max(CASE WHEN category_month_cartesian.monthYear = ''',
                   monthYear,
                   ''' THEN coalesce(tbl_temp.total_sales, 0) END) AS `',
                   monthYear, '`'
               )
  ) INTO @sql
FROM yearly_month_calendar
where monthYearStart >= '2017-01-01'
      and monthYearStart <= '2017-12-31';
You may raise concern ,from where the tables category_month_cartesian , tbl_temp are referred from , this is part of query being concatenated with the query in the following step 3
that is why I cannot execute the above query, since this query depends on the query in the step 3 bellow.
Step 3
in this step I will write a new query, it will join the query result of Step 1 by having the result set in a temporary table with a Cartesian Product which is generated between categories and yearly_month_calendar Tables. I also concatenated the Query in the step 2 with SELECT statement ,
SET @query :=
CONCAT('
    SELECT category_month_cartesian.CategoryID,category_month_cartesian.CategoryName, ', @sql, '
    FROM
    (
      SELECT cat.CategoryID,cat.CategoryName,cal.monthYear,cal.monthYearStart
      FROM yearly_month_calendar AS cal
      CROSS JOIN categories AS cat
     ) category_month_cartesian
    LEFT JOIN tempTableSalesAnalytic tbl_temp
      on category_month_cartesian.CategoryID = tbl_temp.CategoryID
      and category_month_cartesian.monthYear = tbl_temp.month_ordered
      WHERE category_month_cartesian.monthYearStart >= ''',DATE_FORMAT('2017-01-01', '%Y-%m-%d'), '''
       AND category_month_cartesian.monthYearStart <= ''',DATE_FORMAT('2017-12-31', '%Y-%m-%d'),'''
      group by category_month_cartesian.CategoryID'
  );
Well, now ‘@query’ variable contains exactly the same query that I am looking for. and final step is to find a way to run this query, by supplying the dynamic date periods, this is the most simple part we can use PREPARE and EXECUTE commands.
To make it even more easier I created a stored procedure which will execute the entire query by accepting two arguments search_startdate and search_enddate.
Here is my full solution code. Please note that I have replaced the hard coded date string with dynamic parameters.
DROP PROCEDURE IF EXISTS searchYearlyAnalyticData;
DELIMITER $$
CREATE PROCEDURE searchYearlyAnalyticData(IN search_startdate date,IN search_enddate date)
BEGIN
DROP TEMPORARY TABLE IF EXISTS tempTableSalesAnalytic;
CREATE TEMPORARY TABLE tempTableSalesAnalytic AS
  SELECT
    categories.CategoryID,
    categories.CategoryName,
    DATE_FORMAT(orders.OrderDate, '%M-%Y') AS month_ordered,
    SUM(orderdetails.Quantity) AS total_sales
   FROM
    orderdetails
    INNER JOIN
    orders
      ON orderdetails.OrderID = orders.OrderID
    INNER JOIN
    products
      ON orderdetails.ProductID = products.ProductID
     INNER JOIN
    categories
      ON products.CategoryID = categories.CategoryID
  WHERE
    orders.OrderDate >= DATE_FORMAT(search_startdate, '%Y-%m-%d')
    AND orders.OrderDate <= DATE_FORMAT(search_enddate, '%Y-%m-%d')
  GROUP BY
   month_ordered,
     categories.CategoryID
  order by
    orders.OrderDate ASC;

SET @@group_concat_max_len = 75000;
SET @sql = NULL;
SELECT
  GROUP_CONCAT(
  DISTINCT
   CONCAT(
       'max(CASE WHEN category_month_cartesian.monthYear = ''',
       monthYear,
       ''' THEN coalesce(tbl_temp.total_sales, 0) END) AS `',
       monthYear, '`'
   )
  ) INTO @sql
FROM yearly_month_calendar
where monthYearStart >= DATE_FORMAT(search_startdate, '%Y-%m-%d')
      and monthYearStart <= DATE_FORMAT(search_enddate, '%Y-%m-%d');

SET @query :=
CONCAT('
    SELECT category_month_cartesian.CategoryID,category_month_cartesian.CategoryName, ', @sql, '
    FROM
    (
      SELECT cat.CategoryID,cat.CategoryName,cal.monthYear,cal.monthYearStart
      FROM yearly_month_calendar AS cal
      CROSS JOIN categories AS cat
     ) category_month_cartesian
    LEFT JOIN tempTableSalesAnalytic tbl_temp
      on category_month_cartesian.CategoryID = tbl_temp.CategoryID
      and category_month_cartesian.monthYear = tbl_temp.month_ordered
      WHERE category_month_cartesian.monthYearStart >= ''',DATE_FORMAT(search_startdate, '%Y-%m-%d'), '''
       AND category_month_cartesian.monthYearStart <= ''',DATE_FORMAT(search_enddate, '%Y-%m-%d'),'''
      group by category_month_cartesian.CategoryID'
  );


PREPARE statement FROM @query;
EXECUTE statement;
DEALLOCATE PREPARE statement;
DROP TABLE tempTableSalesAnalytic;
SET @@group_concat_max_len = 1024;
END $$
DELIMITER ;
and if you want to know how to call this Stored Procedure in Laravel , please follow one of my previous tutorial in this link, Laravel call Database Stored Procedure with Eloquent ORM, Query Builder | MySQL
Here is the code for how I call the Stored Procedure in my controller and return the json data required by HighChart in the front end,
$db = DB::connection()->getPdo();
$db->setAttribute(PDOConnection::ATTR_ERRMODE, PDOConnection::ERRMODE_EXCEPTION);
$db->setAttribute(PDOConnection::ATTR_EMULATE_PREPARES, true);

if($request->has('start_date') && $request->has('end_date')){
    $start = new Carbon($request->input('start_date'));
    $end = new Carbon($request->input('end_date'));

    $start_str = $start->toDateString();
    $end_str = $end->toDateString();
}else{
    $start = new Carbon('first day of january this year');
    $end = new Carbon();

    $start_str = $start->toDateString();
    $end_str = $end->toDateString();
}

$chart_type = $request->has('chart_type') ? $request->input('chart_type') : 'column';

$queryResult = $db->prepare('call searchYearlyAnalyticData(?,?)');
$queryResult->bindParam(1, $start_str);
$queryResult->bindParam(2, $end_str);
$queryResult->execute();
$result_set = $queryResult->fetchAll(PDOConnection::FETCH_ASSOC);
$queryResult->closeCursor();

$categories = DB::connection()->table('yearly_month_calendar')
    ->select('monthYear')
    ->where('monthYearStart','>=',$start_str)
    ->where('monthYearStart','<=',$end_str)
    ->pluck('monthYear');

$chartArray = [];
$chartArray ["chart"] = array (
    "type" => $chart_type
);
$chartArray ["title"] = array (
    "text" => "Periodical Sales analytics Chart"
);
$chartArray ["subtitle"] = array (
    "text" => "Source: Techalyst.com"
);
$chartArray ["credits"] = array (
    "enabled" => false
);
$chartArray ["xAxis"] = array (
    "categories" => $categories
);

$chartArray ["yAxis"] = array (
    "title" => array (
        "text" => "Total Sales"
    ),
    'labels' => array(
        'format' => '{value}'
    ),
    'min' => '0'
);
$chartArray ["tooltip"] = array (
    "headerFormat" => '<span >{point.key}</span><table>',
    "pointFormat" => '<tr><td style="color:{series.color};padding:0">{series.name}: </td> <td ><b>{point.y} item</b></td></tr>',
    "footerFormat" => "</table>",
    "shared" => true,
    "useHTML" => true,
);

$chartArray ["plotOptions"] = array(
    "column" => array(
        "pointPadding" => '0.2',
        "borderWidth" => '0'
    )
);

foreach ($result_set as $results){
    $i = 0;
    $dataArray = array();
    foreach ($results as $value){
        if($i > 1){
            $dataArray[] = $value;
        }
        $i++;
    }
    $chartArray ["series"] [] = array (
        "name" => $results['description'],
        "data" => $dataArray
    );
}

return response()->json($chartArray)->setEncodingOptions(JSON_NUMERIC_CHECK);
and you have to import the following namespaces in top of your controller file or in the file where you want to call this Stored Procedure
use Carbon\Carbon;
use Illuminate\Support\Facades\DB;
use Doctrine\DBAL\Driver\PDOConnection;
if you have any questions regarding "Laravel, Vue.JS Data Visualization Chart- Most Selling Product of the Year Chart, Periodical Sales analytics Chart , Laravel Data Visualization Query ", please feel free to leave your comment bellow.


Be the first one to write a response :(
{{ reply.member.name }} - {{ reply.created_at_human_readable }}